Health of power distribution companies is a very important facet of growth of power industry as it determines the overall health of the sector and whether the overall business can stay sustainably profitable.
Most improvement and deterioration
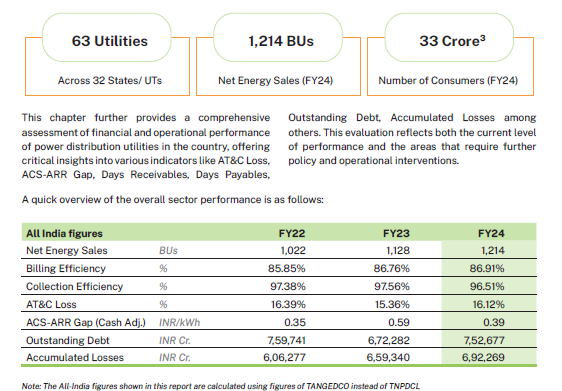
- Overall direction: The sector is gradually improving — cost-recovery (ACS-ARR) narrowed, many utilities cut AT&C losses and billing efficiency ticked up — but risks remain from subsidy shortfalls, concentrated state debt and pockets of poor collection.
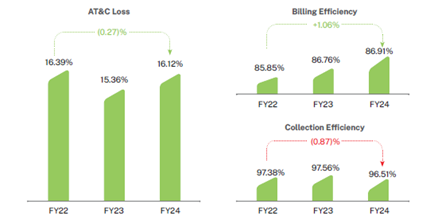
- Concrete numbers: All-India AT&C loss ≈ 16.12% (FY24); billing efficiency 86.91%; collection efficiency 96.51%. ACS-ARR (cash adjusted) fell from ₹0.59/unit (FY23) to ₹0.39/unit (FY24); absolute cash gap fell to ≈ ₹57,854 crore.
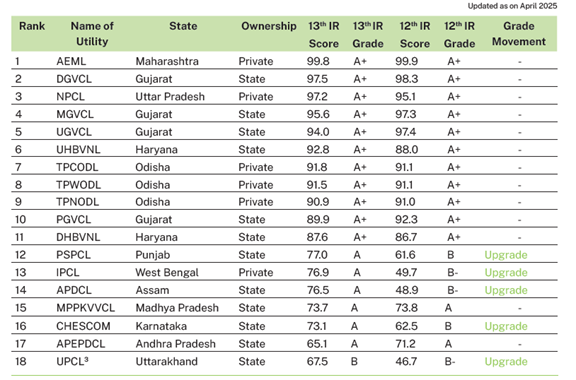
Which states / utilities are doing best (tops)
- Gujarat — all four state utilities (DGVCL, MGVCL, UGVCL, PGVCL) are top-grade (A+) and among the highest scorers — low AT&C losses and strong billing/collection.
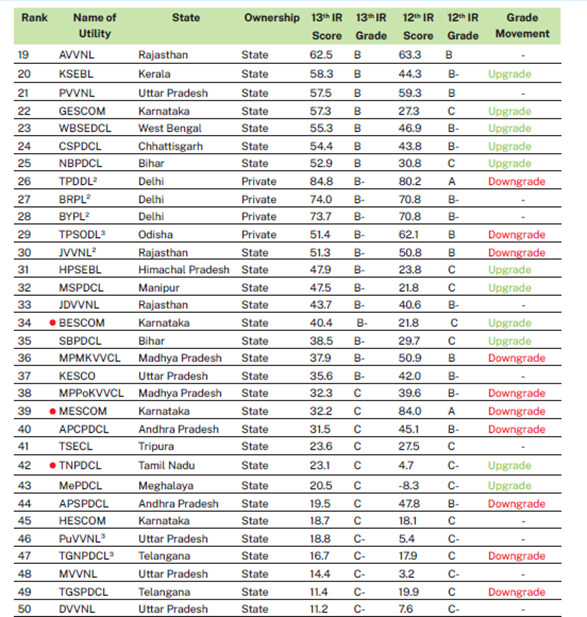
- Private & metro leaders: Adani Electricity Mumbai (AEML), Noida Power (NPCL), Tata Power Delhi (TPDDL), BSES Rajdhani (BRPL) and BSES Yamuna (BYPL) appear among the top performers.
- Other strong states/utilities: Haryana DISCOMs (DHBVNL/UHBVNL), Odisha TP group (TPCODL/TPWODL/TPNODL), Punjab (PSPCL) and selected Kerala/Delhi power departments also score high.
Which states/utilities improved fastest (largest year-on-year gains)
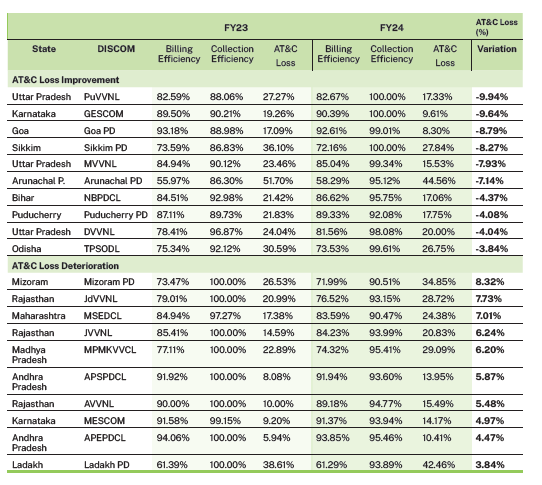
- AT&C loss improvers (big reductions FY23→FY24): PuVVNL (UP), GESCOM (Karnataka), Goa PD, Sikkim PD, MVVNL (UP), Arunachal PD — some saw >7–9 ppt drop in AT&C losses.
- ACS-ARR (cash) improvements > ₹0.50/kWh: Notable financial closers include NDMC (Delhi), BEST (Maha), PuVVNL/MVVNL/DVVNL (UP), TPDDL (Delhi improved its cash position), AEML (Mumbai) and others — Exhibit lists utilities with the largest INR/kWh improvements.
- Rating movement: 21 utilities upgraded their ratings vs previous year and 23 DISCOMs showed an ‘improving’ trajectory (>5% score gain).
Parameters improving (what’s moving in the business)
- ACS-ARR (cost recovery): Improved — cash-adjusted gap improved from ₹0.59/unit → ₹0.39/unit, reducing absolute cash gap to ≈ ₹57,854 Cr. This is one of the most important positive moves.
- Billing efficiency: Small improvement to 86.91% (FY24). 41 utilities improved billing efficiency and 9 improved by >2 ppt.
- AT&C losses: Mixed — all-India AT&C rose slightly vs FY23 (15.36% → 16.12%) because collection dipped, but 41 of 63 utilities reduced AT&C losses; 20 utilities reduced by >2 ppt. So many utilities are improving even though the aggregate ticked up.
- Collection efficiency: Slight decline to 96.51% (FY24) — this is the weak link behind the AT&C uptick.
- Days receivable / payable: Days receivable improved slightly (115 days vs 118), but there are wide variations — many utilities still have long receivable cycles; days payable to GenCo/TransCo remain elevated (~132 days).
- Debt & losses: Outstanding debt and accumulated losses remain large (outstanding debt ≈ ₹7.5 lakh Cr and accumulated losses ~₹6.9 lakh Cr). Debt growth is concentrated in a few states (Rajasthan, Maharashtra, TN, UP, Andhra Pradesh etc.).
Which schemes / rules are driving improvements (and how)
- RDSS (Revamped Distribution Sector Scheme, 2021): Big push for prepaid/smart meters, modernization and performance-linked funding — helps billing accuracy and theft reduction.
- IPDS (2014): Funded IT, ERP and network strengthening (helped centralized billing & backend systems).
- UDAY (2015) — earlier debt restructuring (state takeover of DISCOM debt) that reduced interest burden and enabled more focus on operational improvements.
- Electricity (Right of Consumers) Rules 2020 & LPS Rules 2022: Consumer protection and payment discipline (late payment surcharge rules) that strengthen collection regimes.
- Electricity Distribution (Accounts & Additional Disclosure) Rules 2024: Greater transparency on accounts, subsidies and regulatory assets — helps markets/regulators and lenders better assess utilities.
- Automatic pass-through of fuel costs & timely tariff orders: Many states now have automatic pass-through for fuel costs (19 regulators implemented auto pass-through) — this reduces exposure to rising power purchase costs.
Best practices the report highlights (what actually worked)
- Smart metering + OCR / AMI + theft-detection analytics → improved billing accuracy & revenue protection
- Centralized billing & ERP / digital payments / apps / chatbots → smoother collections & customer service.
- Automation/SCADA, IoT condition monitoring, drone inspections → fewer outages and lower technical losses.
Key risks / remaining issues to watch
- Subsidy realization fell: Aggregate subsidy realization declined from 108.58% (FY23) to 97.40% (FY24) — states not fully disbursing booked subsidies increases cash stress for DISCOMs.
- Debt concentration: A few states (Rajasthan, Maharashtra, Tamil Nadu, UP, Andhra Pradesh) account for a very large share of sector debt — systemic risk if those states slip.
- Collection Efficiency slip: Even a small fall in collection efficiency raises AT&C losses and cash gap — needs targeted recovery & subsidy timeliness.
- Regulatory/tariff timeliness: Delays in true-up and tariff orders in many states create uncertainty; 31 of 57 true-up orders issued were delayed.
Actionable, high-impact recommendations
- Accelerate smart-meter rollout (RDSS push) + ensure meters are revenue-grade + integrate with centralized billing.
- Improve subsidy disbursal discipline (timely state transfers or DBT pilots) to eliminate cash drag on DISCOMs.
- Targeted recovery drives and digital payments to restore collection efficiency above 98% in laggard utilities.
- Focus on top-debt states (structured financial plans, regulator + state coordination) to reduce systemic risk.
Prapti scheme ensures that if any discom doesn’t honour its PPA, they are barred from short term markets the next day. Hence effectively discom are forced to honour now.
For more information on power industry – click here