Skip to content
Mathmarkets
Mathmarkets
  • Home
  • About
  • Company Analysis
  • Industry Analysis
  • Knowledge Bytes
  • Contact
Mathmarkets

Comparison of 2 wheeler companies

chintan, March 1, 2021June 19, 2022

I have done the comparison of 2 wheeler companies in this blog. The Indian 2 wheeler industry is dominated by 4 players.

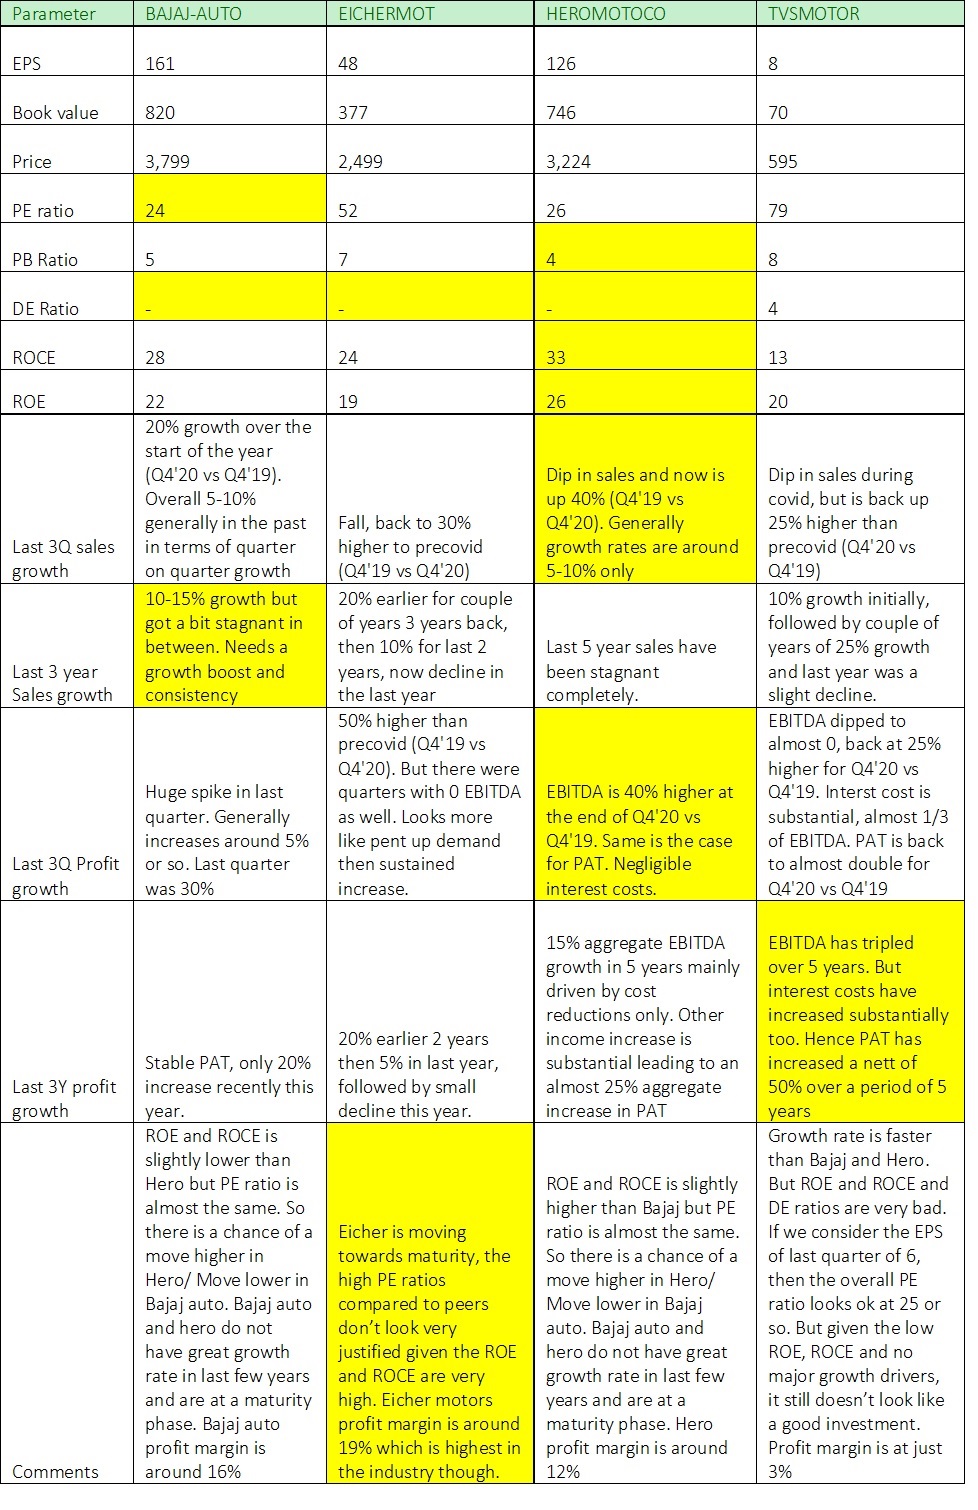
Hero motors have higher ranking in most of the parameters, followed by Bajaj. It is also evident that the PE ratio for Hero motors is lowest in the industry. The only parameter where Hero motors ranks lower is the profit margin which is 12% vs 19% for Eicher.

Also, there is little downside risk in investing in Hero and Bajaj as the PE ratios are much lower as well as their high score in return ratios as well as recent growth post covid. Also, Eicher has a very high PE ratio and recent results do not encourage, as a result there is a substantial chance of a correction in the stock price compared to the industry leaders. TVS motors has very high PE ratios and very small margin with not very encouraging return ratios. The only thing going is the high growth in profits over the last few years.


The columns highlighted in yellow indicate the best performer in the industry for that parameter.


Also view my analysis on the FMCG players if you like my comparison of 2 wheeler companies.

Industry Analysis

Post navigation

Previous post
Next post

Related Posts

Industry Analysis Textile

Comparison of textile yarn companies

January 4, 2025January 4, 2025

The table below provides comparison of textile yarn companies in India. An important thing to note is that the yarn companies are present in either cotton yarn or synthetic yarn and both have different financial advantages. Also, though the industry goes through cycles, stronger companies outperform the weaker ones in…

Read More
Industry Analysis Retail Industry

India’s retail industry

July 5, 2025July 5, 2025

India’s retail industry is one of the most dynamic and fast-growing sectors in the country, characterized by its vast unorganized base and rapid shift toward organized formats. This article provides a detailed look at the industry’s current landscape, growth potential, structural breakdown, and how India compares globally. Market Structure and…

Read More
Industry Analysis

Comparison of top 3 IT companies

February 17, 2021June 19, 2022


Read More

Leave a Reply Cancel reply

Your email address will not be published. Required fields are marked *

Recent Posts

  • India’s oil supply chain
  • Importance of Capital Allocation
  • Narayana Health’s development of Health City Cayman Islands
  • Health of power distribution companies
  • Indian power industry

Subscribe to Math Markets

Loading

Archives

  • March 2026
  • December 2025
  • November 2025
  • September 2025
  • July 2025
  • March 2025
  • January 2025
  • December 2024
  • November 2024
  • October 2024
  • September 2024
  • August 2024
  • July 2024
  • June 2024
  • May 2024
  • April 2024
  • March 2024
  • February 2024
  • November 2023
  • September 2023
  • August 2023
  • July 2023
  • May 2023
  • July 2022
  • June 2022
  • April 2022
  • September 2021
  • August 2021
  • July 2021
  • June 2021
  • May 2021
  • April 2021
  • March 2021
  • February 2021

Categories

  • Company Analysis
  • Industry Analysis
  • Knowledge Bytes
  • Uncategorized
All the contents published on this blog and other tools offered are the property of Chintan Shah. All rights reserved. The information contained on this website and the resources available for download through this website are for educational and informational purposes only. The stocks discussed in this blog are the research and personal views of the authors should ‘not’ be considered as any kind of buy, sell or any advisory/recommendation.
©2026 Mathmarkets | WordPress Theme by SuperbThemes