Skip to content
Mathmarkets
Mathmarkets
  • Home
  • About
  • Company Analysis
  • Industry Analysis
  • Knowledge Bytes
  • Contact
Mathmarkets

India consumption story

chintan, December 7, 2024December 7, 2024

India is now the largest population in the world and the India consumption story is currently evolving at a rapid pace. Below are some interesting numbers about how India spends currently.

India GDP per capita is around 2500$ of which 51% of it is consumed and hence per capita spend in consumption is around $1287. Below is the break – up of $1287.

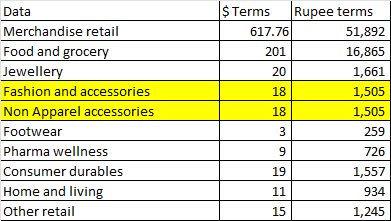
It is interesting to see that per capita spending is mainly in food and grocery. This is an indication of lack of discretionary spending ability in India which will keep evolving over a period. As an economy moves to richer state, the per capita spend in food and grocery almost stagnates and the spending in other discretionary areas like apparel, fashion, footwear, consumer durables increase.

Another interesting point is that the per capita per annum spend in jewelry is higher than fashion and apparels. Footwear is just 260 rupees per annum ($3)

Below is the market size of these industries

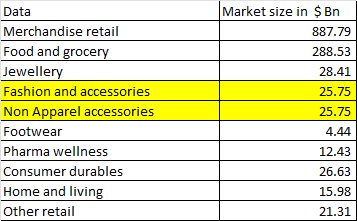
As India moves to higher GDP per capita; the spending in discretionary items may increase at a rate faster than GDP growth given that spending in food (which is currently the biggest) will not increase at the same rate. Lets wait to see if India consumption story follows the same trends as other countries in the world.

For more articles – click here

Knowledge Bytes Uncategorized

Post navigation

Previous post
Next post

Related Posts

Knowledge Bytes Repo rate

Relationship between Repo rates and Nifty index

June 9, 2022June 18, 2022
Read More

Knowledge Bytes – Option Pricing

April 2, 2021June 19, 2022


Read More
Industry Analysis Power industry

Indian power industry

November 12, 2025November 12, 2025

India Power industry is a dynamic industry consisting of various elements from producers, distributors, transmitters to end consumers. India is one of the largest global power producer and consumers. All number in GW FY2025 India power production – Billion units 1,821 India power capacity – GW 475 India power capacity…

Read More

Leave a Reply Cancel reply

Your email address will not be published. Required fields are marked *

Recent Posts

  • Aircraft fleet
  • India’s Workforce: The Complete Picture
  • India’s Natural Gas — The Complete Story
  • India’s oil supply chain
  • Importance of Capital Allocation

Subscribe to Math Markets

Loading

Archives

  • April 2026
  • March 2026
  • December 2025
  • November 2025
  • September 2025
  • July 2025
  • March 2025
  • January 2025
  • December 2024
  • November 2024
  • October 2024
  • September 2024
  • August 2024
  • July 2024
  • June 2024
  • May 2024
  • April 2024
  • March 2024
  • February 2024
  • November 2023
  • September 2023
  • August 2023
  • July 2023
  • May 2023
  • July 2022
  • June 2022
  • April 2022
  • September 2021
  • August 2021
  • July 2021
  • June 2021
  • May 2021
  • April 2021
  • March 2021
  • February 2021

Categories

  • Company Analysis
  • Industry Analysis
  • Knowledge Bytes
  • Uncategorized
All the contents published on this blog and other tools offered are the property of Chintan Shah. All rights reserved. The information contained on this website and the resources available for download through this website are for educational and informational purposes only. The stocks discussed in this blog are the research and personal views of the authors should ‘not’ be considered as any kind of buy, sell or any advisory/recommendation.
©2026 Mathmarkets | WordPress Theme by SuperbThemes