Skip to content
Mathmarkets
Mathmarkets
  • Home
  • About
  • Company Analysis
  • Industry Analysis
  • Knowledge Bytes
  • Contact
Mathmarkets

Fundamental scores of companies

chintan, June 7, 2021June 20, 2022

This is an amalgamation of a lot of fundamental research on the following companies. 


Below I have rated companies based on some fundamental parameters to arrive at a quantitative way to evaluate companies. This will help in not just having a clear comparison of individual companies but also in identifying the fundamentally strongest companies in any sector. This is also used in the mathmarkets model for arriving at trade and investment triggers. 


The higher the score, the better is the company placed from a fundamental perspective. The criteria used for analyzing them are as follows:
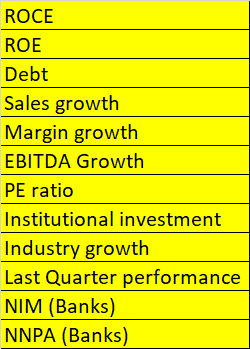


Companies are given ratings based on each of the above parameters from 1 to 3. Higher the rating, the better is the performance of the company in that parameter. Based on the rating, the final rating for the companies are as follows:
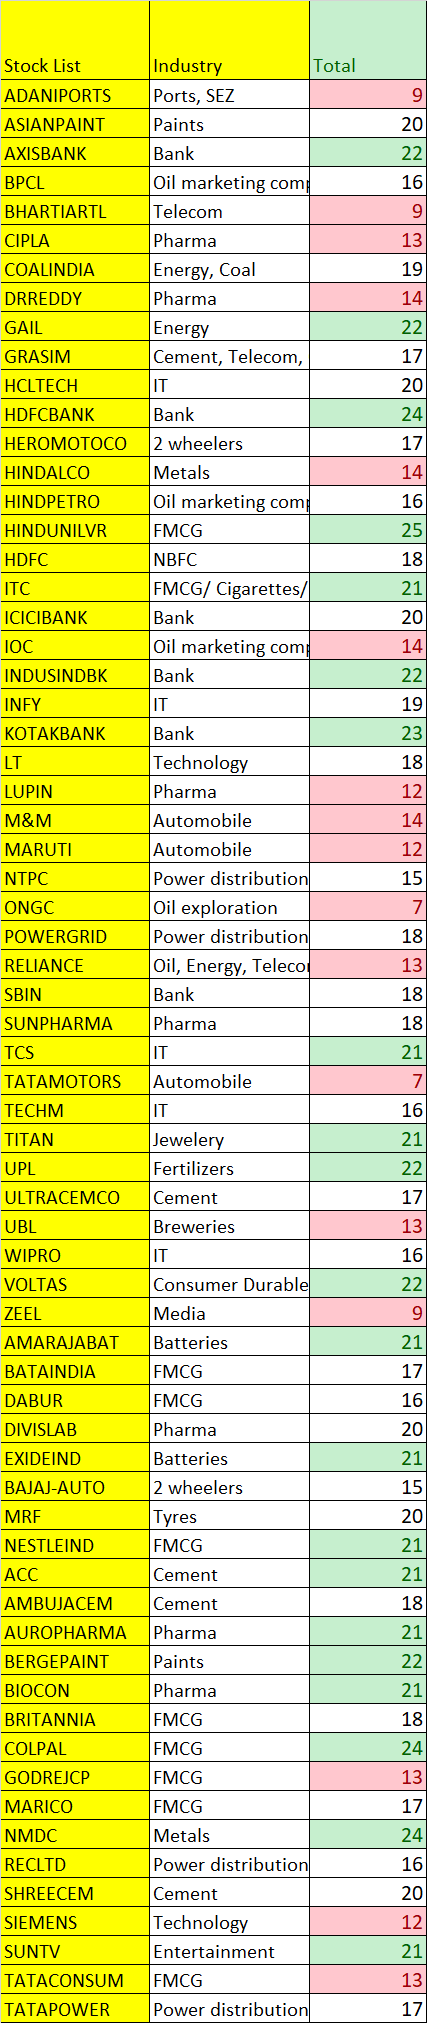


Note that the rating will keep evolving over a period based on performance changes and prices as well. 

 

Industry Analysis

Post navigation

Previous post
Next post

Related Posts

Industry Analysis

India’s car industry growth prospects

March 15, 2025March 15, 2025

India’s car industry growth prospects can be analyzed by looking at the following charts. India, a country with one of the world’s largest populations, currently has one of the lowest vehicle ownership rates globally.  Despite its vast network of roadways, the number of vehicles per 1,000 people remains significantly below…

Read More
Industry Analysis IT employees

Infosys vs TCS – Employee costs trends

August 15, 2021June 20, 2022


Read More
Industry Analysis Power industry

Indian power industry

November 12, 2025November 12, 2025

India Power industry is a dynamic industry consisting of various elements from producers, distributors, transmitters to end consumers. India is one of the largest global power producer and consumers. All number in GW FY2025 India power production – Billion units 1,821 India power capacity – GW 475 India power capacity…

Read More

Recent Posts

  • Aircraft fleet
  • India’s Workforce: The Complete Picture
  • India’s Natural Gas — The Complete Story
  • India’s oil supply chain
  • Importance of Capital Allocation

Subscribe to Math Markets

Loading

Archives

  • April 2026
  • March 2026
  • December 2025
  • November 2025
  • September 2025
  • July 2025
  • March 2025
  • January 2025
  • December 2024
  • November 2024
  • October 2024
  • September 2024
  • August 2024
  • July 2024
  • June 2024
  • May 2024
  • April 2024
  • March 2024
  • February 2024
  • November 2023
  • September 2023
  • August 2023
  • July 2023
  • May 2023
  • July 2022
  • June 2022
  • April 2022
  • September 2021
  • August 2021
  • July 2021
  • June 2021
  • May 2021
  • April 2021
  • March 2021
  • February 2021

Categories

  • Company Analysis
  • Industry Analysis
  • Knowledge Bytes
  • Uncategorized
All the contents published on this blog and other tools offered are the property of Chintan Shah. All rights reserved. The information contained on this website and the resources available for download through this website are for educational and informational purposes only. The stocks discussed in this blog are the research and personal views of the authors should ‘not’ be considered as any kind of buy, sell or any advisory/recommendation.
©2026 Mathmarkets | WordPress Theme by SuperbThemes