Skip to content
Mathmarkets
Mathmarkets
  • Home
  • About
  • Company Analysis
  • Industry Analysis
  • Knowledge Bytes
  • Contact
Mathmarkets

Comparison of textile yarn companies

chintan, January 4, 2025January 4, 2025

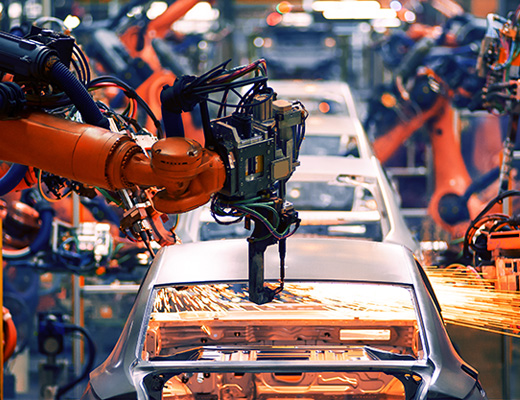
The table below provides comparison of textile yarn companies in India. An important thing to note is that the yarn companies are present in either cotton yarn or synthetic yarn and both have different financial advantages.

Also, though the industry goes through cycles, stronger companies outperform the weaker ones in them. It is clearly evident from the table below. Companies which manage their costs well – employee, power, sales and marketing, admin are able to do well despite having similar gross margins. Also, companies which are able to efficiently turn their assets and use capital effectively, generate higher ROCE as evident below.

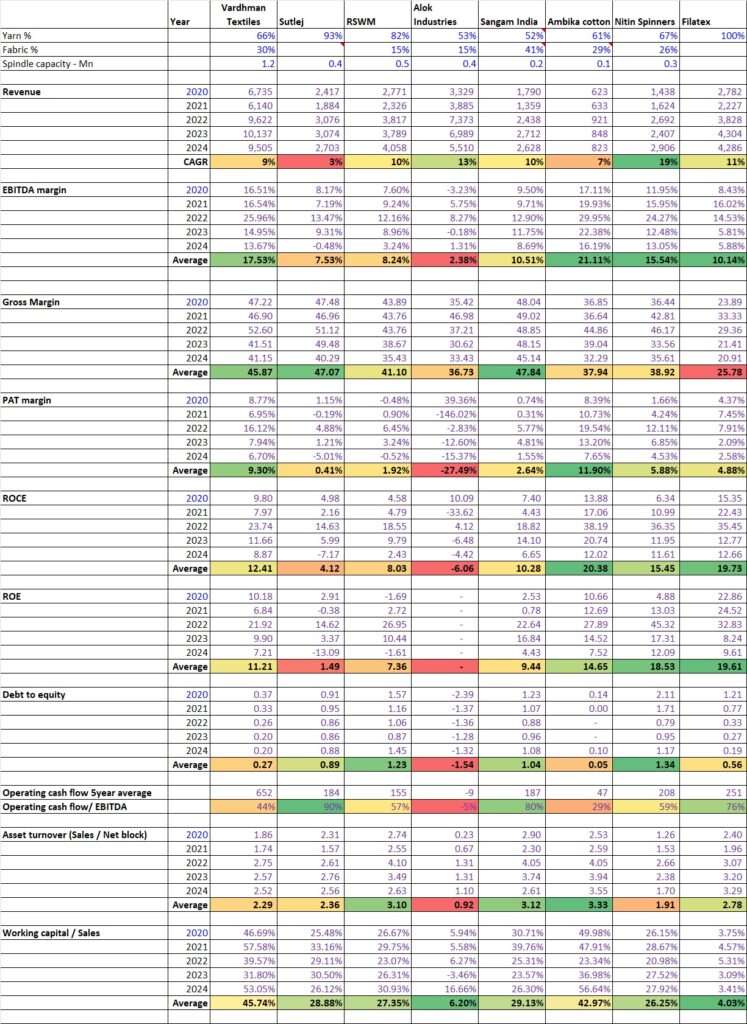
As can be seen, some companies outperform others even during the worst periods of the business cycle. Further study reveals that the companies which outperform have certain advantages like – lower power cost due to captive plants, better machinery with latest technology, advantage over raw material, well managed employee costs, higher asset turns which improve efficiency. The comparison of textile yarn companies above reveals which are the strongest and best managed businesses in this space.

For more such industry analysis – click here.

Industry Analysis AlokAmbika cottoncotton yarnNitinNitin spinnersNiting spinnersRSWMSutlejtextileVardhman textiles

Post navigation

Previous post
Next post

Related Posts

Industry Analysis

Trend in margins for Infosys vs TCS

September 15, 2021June 20, 2022


Read More
Company Analysis AIL

Aarti Industries

May 18, 2024May 18, 2024

Aarti Industries is one the largest specialty chemicals company in India. Below is a quick summary about it. Key points The global chemical industry is around $4 trillion with specialty chemicals being $1 trillion and the commodity chemicals being $ 1 trillion. Of this $4 trillion chemicals industry, India has…

Read More
Industry Analysis Specialty Chemicals

Comparison of performance of specialty chemicals companies

June 15, 2024June 15, 2024

Below is the Comparison of performance of specialty chemicals companies over the last 5 years. Though each company is present in a particular value chain and has specific strengths and moats, below numbers give a high level comparison of all the companies in that space. I have posted details about…

Read More

Leave a Reply Cancel reply

Your email address will not be published. Required fields are marked *

Recent Posts

  • India’s car industry growth prospects
  • Road length and density by country
  • Comparison of textile yarn companies
  • Go Fashion
  • India consumption story

Subscribe to Math Markets

Loading

Archives

  • March 2025
  • January 2025
  • December 2024
  • November 2024
  • October 2024
  • September 2024
  • August 2024
  • July 2024
  • June 2024
  • May 2024
  • April 2024
  • March 2024
  • February 2024
  • November 2023
  • September 2023
  • August 2023
  • July 2023
  • May 2023
  • July 2022
  • June 2022
  • April 2022
  • September 2021
  • August 2021
  • July 2021
  • June 2021
  • May 2021
  • April 2021
  • March 2021
  • February 2021

Categories

  • Company Analysis
  • Industry Analysis
  • Knowledge Bytes
  • Uncategorized
All the contents published on this blog and other tools offered are the property of Chintan Shah. All rights reserved. The information contained on this website and the resources available for download through this website are for educational and informational purposes only. The stocks discussed in this blog are the research and personal views of the authors should ‘not’ be considered as any kind of buy, sell or any advisory/recommendation.
©2025 Mathmarkets | WordPress Theme by SuperbThemes