Bharat Forge
Bharat Forge is a preferred Technology & Engineering driven development partner and global leader in metal forming. It serves several sectors including Automotive, Railways, Aerospace, Marine, Oil & Gas, Power, Construction and Mining. Being the world’s largest forging company and amongst one of the best aerospace forging companies and automotive forging company, it has transcontinental presence across different manufacturing locations spread across India, Germany, Sweden, France and North America.
Part of the Kalyani Group, the company has the largest repository of metallurgical know-how, design & engineering expertise, and manufacturing prowess in the region, which has established it as one the leading forging manufacturers in India. It is backed by many years of experience in manufacturing a wide range of high performance, critical and safety components. It offers full-service supply capability to its geographically dispersed marquee customers from concept to product design, engineering, manufacturing, testing & validation and has very strong R&D capabilities as state-of-the-art technology.
Business area of the company
Bharat Forge manufactures an extensive array of critical and safety components for several sectors including Automobiles (across Commercial & Passenger Vehicle), Oil & Gas, Aerospace, Locomotives, Marine, Energy (across renewable and non-renewable sources), Construction, Mining and General Engineering. Following is the list of products:
Automotive Products: Crankshaft, Connecting Rod, Dosing Components, Common rail, Front Axle Beams, Steering Knuckles, Control Arm, Knuckle, Fork, Reinforcement Bracket, Main & Counter Shafts, Input Shaft & Output Shafts.
Power Products: Proof Machined Rotor, Fully Machined Rotor, Generator, Welded Rotor, Fully Machined, Proof Machined, Thrust Block, Trunion, Labryinth Seal, Bush, Pole End Plate, Wicket Gate, Pelton Bucket, Pelton Disc.
Oil & Gas Products: Spool Body, Mandrel, Connectors, Ring, Casing spool, Gate valve body, Shell, Y block, Quintplex fluid end, Single cyl fluid end, Double bop.
Rail Products: Crankshafts, Connecting Rod, Carrier Plston, Piston Crown, Top Deck End & Center, Retainer Cyl Head, Turbine Wheel Impeller Balance Assembly, Machined Compressor Impeller, Turbine Disc Bucket Assembly, Motor Support, Primary Support, Machined Locomotive Axle, Forged Portal Axle, Forged Gear Blank, Power Electronics.
Marine Products: Propeller, Marine Motor, Stern Tube, Crankshaft, Conrod, Piston Rod, Stock, Trunk, Pintle.
Aerospace Products: Blisk blade, OGV blade, Fan blade, Shaft, LPC Disc, HP Disc, Flap Track, Trailing Arm, Upper Torque Link.
Construction & Mining Products: Tracklink for Construction, Front Spindle For Construction, Machined Crankshaft, Injector Body.
Management team
| Name | Designation | Reported Designation | Since when? |
| B N Kalyani | Chairman | Chairman & Managing Director | More than 30 years |
| Tejaswini Chaudhari | Company Secretary | Company Secretary | 2016 – Started as compliance officer |
| Amit B Kalyani | Deputy Managing Director | Deputy Managing Director | Exec Director in 2008 |
| G K Agarwal | Deputy Managing Director | Deputy Managing Director | Atleast 2008 |
| B P Kalyani | Executive Director | Executive Director | Exec Director in 2008 |
| Kishore Saletore | Executive Director | Executive Director | 2014 |
| S E Tandale | Executive Director | Executive Director | Atleast 2008 |
| Kanwar Bir Singh Anand | Independent Director | Independent Director | 2022 |
| Sonia Singh | Independent Director | Independent Director | 2022 |
| Dipak Mane | Non-Executive Independent Director | Non-Executive Independent Director | 2019 |
| Lalita D Gupte | Non-Executive Independent Director | Non-Executive Independent Director | Director in 2008 |
| Murali Sivaraman | Non-Executive Independent Director | Non-Executive Independent Director | 2019 |
| PH Ravikumar | Non-Executive Independent Director | Non-Executive Independent Director | Was additional director in 2008 |
| Pratap G Pawar | Non-Executive Independent Director | Non-Executive Independent Director | 2011 |
| Vimal Bhandari | Non-Executive Independent Director | Non-Executive Independent Director | 2013 |
Almost the entire top management has been with the company for more than 5 years, and most of them for more than 10 years. As per annual report BN Kalyani and BP Kalyani are not related.
Financials
The following is the key financials for the company:
| Rs. Millions | Mar-17 | Mar-18 | Mar-19 | Mar-20 | Mar-21 | Mar-22 |
| Gross Sales | 65981.56 | 84146.72 | 101457.33 | 80558.44 | 63362.61 | 104610.78 |
| Growth | -6% | 31% | 21% | -21% | -21% | 65% |
| EBITDA | 12510.49 | 17168.05 | 20207.35 | 11103.32 | 8617.38 | 19680.38 |
| EBITDA Margin | 20% | 21% | 20% | 14% | 14% | 19% |
| Growth | -11% | 37% | 18% | -45% | -22% | 128% |
| Interest | 999.62 | 1065.31 | 1272.15 | 1713.29 | 1077.29 | 1604.05 |
| PAT | 5691.52 | 8497.94 | 10439.71 | 4710.65 | 2092.36 | 10176.76 |
| PAT Margin | 11% | 9% | 10% | 4% | -2% | 10% |
| Growth | -13% | 49% | 23% | -55% | -56% | 386% |
| RoCE | 9% | 13% | 13% | 6% | 2% | 10% |
| RoE | 17% | 16% | 19% | 7% | -2% | 16% |
| Debt to Equity | 0.77 | 0.71 | 0.75 | 0.86 | 1.02 | 0.95 |
| Net Sales / Capital | 1.55 | 1.79 | 1.88 | 1.53 | 1.16 | 1.58 |
| Working Capital to Sales | 25% | 24% | 26% | 27% | 32% | 31% |
Sales growth has been 10% CAGR over last 5 years despite covid slowdown. EBITDA margin has been hovering around 18%-20% (except covid years). Refer to peer comparison section for greater commentary on business resilience/ margins.
| Break up by geography: | Break up by revenue type: | ||||||
| Geography | Revenue % | Type | India | International | |||
| India | 41% | Industrial | 17% | 24% | |||
| Americas | 42% | PV | 5% | 10% | |||
| Europe | 15% | CV | 18% | 26% | |||
| RoW | 2% | ||||||
Further drill down of the key businesses and the growth guidance from management:
| Category | Revenue (in Crores) | Growth Expectation / Outlook from management |
| India CV | 1800 | Strong double digit CAGR over the next 2 -3 years |
| India PV | 500 | At least 30% growth even if there is no change in the underlying markets |
| India Industrial | 1700 | Double digit CAGR over the next 3-5 years |
| o/w Defence & Aerospace | 170 | Total defence should increase from 500 crore to 1500 Crore in next 3 years |
| o/w Agri | 255 | |
| o/w Railways | 85 | Huge focus on railways to aid high double digit CAGR over next 3 years |
| o/w Mining & Construction | 561 | Mining and construction will be aided by strong infra push |
| o/w Others | 629 | |
| Sanghvi Forgings (Acquired in 2021) | 390 | 1200 crores in next 5 years |
| JS Auto Cast (Acquired in 2022) | 1600 | 3200 crores in next 3 years |
| US North Carolina | 650 | 1300 Crore in FY26 |
| Europe – CV &PV | 750 | |
| US Industrial Exported from India/ Europe | 1775 | Double digit CAGR over the next 3-5 years |
| o/w Oil & Gas | 887.5 | |
| o/w Defence & Aerospace | 177.5 | Total defence should increase from 500 crore to 1500 Crore in next 3 years |
| o/w Construction & Mining | 710 | |
| US CV + PV Exported from India/ Europe | 1775 | |
| Europe – Industrial | 750 | Double digit CAGR over the next 3-5 years |
| o/w Oil & Gas | 375 | |
| o/w Defence & Aerospace | 75 | Total defence should increase from 500 crore to 1500 Crore in next 3 years |
| o/w Construction & Mining | 300 |
The management of Bharat Forge has guided for a minimum double digit CAGR across every business area with more than 20% CAGR growth in Defense, Sanghvi forgings, JS auto cast and US North carolina business. As per management guidance a 15% CAGR appears achievable. Let us look at the historical industry landscape to arrive at industry benchmarks.
Peer Comparison
| Bharat Forge – Consol | Bharat Forge – Standalone | Mahindra CIE – Consol | Mahindra CIE – Standalone | MM Forgings | |||||||||||||||||||
| 2019 | 2020 | 2021 | 2022 | 2019 | 2020 | 2021 | 2022 | 2018 | 2019 | 2020 | 2021 | 2018 | 2019 | 2020 | 2021 | 2019 | 2020 | 2021 | 2022 | ||||
| Revenue (In Crore) | 10,146 | 8,056 | 6,336 | 10,461 | 6,520 | 4,564 | 3,652 | 6,255 | 8,103 | 7,954 | 6,050 | 8,387 | 3,146 | 2,895 | 2,145 | 3,291 | 904 | 727 | 726 | 1,105 | |||
| Growth | 21% | -21% | -21% | 65% | 23% | -30% | -20% | 71% | 24% | -2% | -24% | 39% | 52% | -8% | -26% | 53% | 46% | -20% | 0% | 52% | |||
| Raw Materials % | 42% | 44% | 42% | 40% | 37% | 38% | 39% | 41% | 45% | 48% | 46% | 48% | 51% | 50% | 47% | 51% | 45% | 46% | 48% | 46% | |||
| Power & Fuel % | 6% | 6% | 6% | 6% | 7% | 8% | 7% | 6% | 5% | 5% | 6% | 5% | 6% | 6% | 7% | 6% | 9% | 10% | 10% | 8% | |||
| Employees % | 12% | 15% | 17% | 14% | 7% | 11% | 12% | 8% | 17% | 17% | 21% | 16% | 12% | 13% | 17% | 13% | 8% | 11% | 10% | 9% | |||
| Other Manufacturing % | 11% | 11% | 12% | 11% | 11% | 11% | 12% | 12% | 15% | 13% | 14% | 13% | 11% | 12% | 14% | 13% | 10% | 9% | 8% | 9% | |||
| General & admin % | 2% | 1% | 2% | 2% | 1% | 2% | 3% | 2% | 6% | 6% | 5% | 5% | 5% | 4% | 3% | 2% | 1% | 1% | 1% | 1% | |||
| Selling and Distribution % | 3% | 3% | 3% | 4% | 2% | 1% | 2% | 2% | 0% | 0% | 0% | 0% | 2% | 2% | 2% | 2% | 5% | 5% | 5% | 7% | |||
| Miscallenous % | 5% | 5% | 5% | 4% | 5% | 7% | 5% | 3% | 0% | 0% | 0% | 0% | 0% | 0% | 0% | 0% | 2% | 2% | 2% | 1% | |||
| EBITDA Margin | 20% | 14% | 14% | 19% | 29% | 22% | 20% | 27% | 12% | 12% | 8% | 12% | 13% | 12% | 9% | 13% | 19% | 17% | 17% | 18% | |||
| PAT Margin | 10% | 5% | -2% | 11% | 16% | 10% | 9% | 17% | 6% | 4% | 2% | 5% | 3% | 6% | 3% | 3% | 3% | 2% | 1% | 4% | |||
| EBITDA/ Interest | 18 | 8 | 10 | 14 | 20 | 8 | 11 | 18 | 19 | 18 | 9 | 19 | 68 | 28 | 19 | 37 | 7 | 4 | 5 | 8 | |||
As can be seen from the above table Bharat Forge Standalone business has extremely high EBITDA margin compared to its peers. Following are the key reasons:
- Bharat forge does a lot of CV forgings and high-end industrial applications – Higher the end of the forging, better is the margin – Order is Industrial forging, CV forging, PV forging and 2-wheeler forging in the decreasing order of margins.
- Bharat forge has strong backward integration where more than 50% of the raw materials is sourced from Kalyani companies, this ensures cost savings across the value chain, as can be seen from the cost of raw materials being the lowest in the industry for the standalone business.
- The consolidated EBITDA margin is much lower as the company was investing into building the Europe and US business, both had low single digit or even negative margins. Now that the business has stabilized, the management believes that they will generate low double-digit margins and hence overall consolidated margin will improve.
- Also, one must note that Bharat forge spends extensively on research and development – despite that they have higher margins.
- Besides, the defense business was all EBITDA negative until now – once it starts delivering, EBITDA margins may improve further.
Industry landscape:
Following is the data for the key target segments (PV and CV) in EU, USA and India (in 000s units)
| 2009 | 2010 | 2011 | 2012 | 2013 | 2014 | 2015 | 2016 | 2017 | 2018 | 2019 | 2020 | Average | |
| Total EU PV | 10,318 | 11,313 | 11,524 | 10,527 | 10,572 | 10,964 | 11,805 | 12,198 | 12,223 | 11,513 | 10,532 | 7,705 | |
| Change | -13% | 10% | 2% | -9% | 0% | 4% | 8% | 3% | 0% | -6% | -9% | -27% | -1% |
| Total EU CV | 1,109 | 1,523 | 1,783 | 1,573 | 1,740 | 1,732 | 1,559 | 2,117 | 2,118 | 2,160 | 2,147 | 1,722 | |
| Change | -47% | 37% | 17% | -12% | 11% | 0% | -10% | 36% | 0% | 2% | -1% | -20% | 3% |
| EU GDP Change | -4% | 2% | 2% | -1% | 0% | 2% | 2% | 2% | 3% | 2% | 2% | -6% | 1% |
| Total US CV | 4,309 | 5,229 | 5,963 | 6,462 | 7,046 | 7,779 | 8,532 | 8,824 | 9,051 | 9,624 | 10,133 | 9,011 | |
| Change | -23% | 21% | 14% | 8% | 9% | 10% | 10% | 3% | 3% | 6% | 5% | -11% | 6% |
| Total US PV | 3,558 | 3,791 | 4,146 | 5,120 | 5,433 | 5,610 | 5,595 | 5,146 | 4,593 | 4,087 | 3,544 | 2,560 | |
| Change | -21% | 7% | 9% | 23% | 6% | 3% | 0% | -8% | -11% | -11% | -13% | -28% | -1% |
| US GDP Change | -3% | 3% | 2% | 2% | 2% | 2% | 3% | 2% | 2% | 3% | 2% | -3% | 2% |
| India PV | 1,781 | 2,317 | 2,479 | 2,520 | 2,370 | 2,384 | 2,545 | 2,621 | 2,751 | 2,761 | 2,317 | 1,707 | |
| Change | 18% | 30% | 7% | 2% | -6% | 1% | 7% | 3% | 5% | 0% | -16% | -26% | 5% |
| India CV | 861 | 1,237 | 1,461 | 1,629 | 1,526 | 1,481 | 1,606 | 1,868 | 2,032 | 2,414 | 2,199 | 1,687 | |
| Change | 6% | 44% | 18% | 11% | -6% | -3% | 8% | 16% | 9% | 19% | -9% | -23% | 10% |
| India GDP Change | 8% | 9% | 5% | 5% | 6% | 7% | 8% | 8% | 7% | 6% | 4% | -7% | 7% |
As can be seen from the above table:
From 2009 to 2019:
EU & US PV declined at -1% average vs EU GDP change of 1%
EU CV expanded at 3% average vs EU GDP change of 1% —– GDP multiplier of 3
US CV grew at 6% vs 2% average GDP change —– GDP multiplier of 3
For India, the PV expanded at 5% and CV expanded at 10% vs a GDP change of 7%
This helps us arrive at the following base case revenue growth assumptions:
India CV growth of 1.5*GDP is very reasonable as even matured markets have shown above 2x GDP growth in CVs
EU and US, CVs have grown at 3x of GDP which is a major part of the portfolio for Bharat Forge – Even despite a maturity, an average of 1.25x of GDP growth seems conservatively reasonable. CV growth assumptions seem reasonable in US because of their lack of rail infrastructure and high dependence on road infrastructure for transport of goods.
The above data does not consider the price increase but is simply the number of units sold, we assume a 2% price increase to arrive at our calculations for revenue growth.
Industrials –
With the huge budget spends in both India and US in industrial/ infrastructure, we expect continued strength in demand for Bharat forge products. Also, the focus of government for Make in India/ PLIs/ Local infrastructure boost as well as the consideration that most of the US infrastructure is old and ageing augers well for the spending in industrials and infrastructure segment. We can assume its growth to exceed the GDP growth rate.
Investment argument for next 10 years
- Strength in CV space (India): Historically, the Indian CV growth rate has been 1.5 x of the GDP growth. Also, given the focus on overall growth in infrastructure, business activity, logistics, sophistication of demand – the demand for CVs should increase in India. Shriram group expects a 15% CAGR growth for CVs in India and it is generally seen that CV growth is around 1.5 times of the GDP growth of 7%. Bharat Forge have also received a PLI approval for automotive technology.
- Strength in CV space (Global): GDP growth in US and Europe is expected to be muted at around 3%. Even if the company grows at 1.5x of GDP growth followed by 2% price increase, we expect the growth to be around 6.5%. We expect the growth of the company to be far higher given that there will be significant market share gains due to the following – competitiveness of Indian forging players due to low-cost steel availability in India, better acceptability of Indian products due to higher approvals and stronger client relationship entrenchment, consolidation due to higher energy costs in Europe and lack of competitiveness of the overall steel and infrastructure development industry vis-à-vis emerging markets.
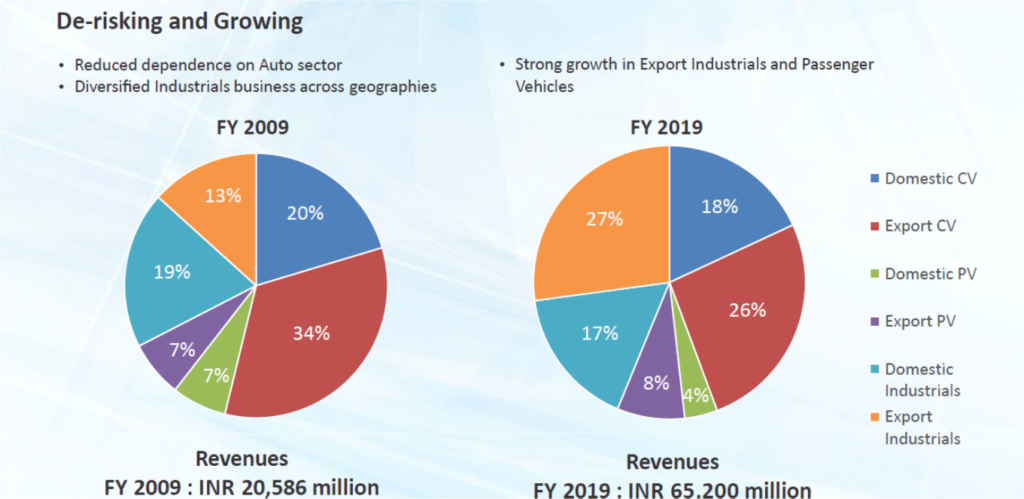
- Diversification in industrial business
Below is the commercial vehicles business and the industrial business break-up in 2009 vs 2019.
Aerospace: Aerospace now accounts for more than 10% of our industrial export revenue. This same number for last year was 2%. This is result of many years of hard work and start of ramp up of a couple of our customer programs. We now have in addition to these programs that are active, two new programs from two new customers, in addition who have given us long term orders. So we will now have three distinct product segments which will allow us to create almost like product verticals within Bharat Forge for aerospace and become a large, meaningful supplier in these areas. And I believe that the best years in terms of growth for aerospace for us are now about to start and you will see Y-o-Y very strong growth. (Q1FY23 earnings call)
In the construction and mining side, just given the government stimulus in most markets, there is a strong demand seen and I am talking about both Europe, US and of course with the pragmatic budget, we expect the same in India as well. Oil and gas is doing better than what it was last year. You know, we play in the fracking business of the oil and gas side and we see a significantly improved activity of the fracking side. (Q3FY22 earnings call)
In the domestic, I would say out of the 220 odd crores more than one- third is construction and mining. Agriculture is about 15%, aerospace is about 10% and then you have assorted other sectors which are about 30%.(Q3FY22 earnings call)
The point the US has decided to spent 500 plus billion dollars on infrastructure and this is going to go in areas like roads, bridges, water, rain, electricity and basic infrastructure. So, when you have basic infrastructure this kind of infrastructure spending has a tremendous catering impact throughout the whole ecosystem. So, this will boost truck production, this will boost demand for trucks, demand for construction equipment, demand for high horse power engines, for diesel gensets, for compressors, all kinds of equipment even airports are being now looked at from upgradation because a lot of US infrastructure which was built in the 40s and 50s was last upgraded in the 70s and 80s and 40 years is a long time and you can see the impact of the degradation in the US infrastructure every winter when you have storms and power outages. So, I think this is a very good step it will definitely improve the quality of infrastructure and quality of life in the US, but also provides massive boost to the US economy and global supply chains. (Q2FY22 earnings call)
- Optionality from defense business
Coming to defense, as I mentioned last time that the artillery gun has passed all its trials. And I’m extremely proud and happy to report that our artillery gun which is co-developed with DRDO will be showcased in the 15th August Amrit Mahotsav of Independence Day at Red Ford as a part of the 21 gun salute. (Q1FY23 earnings call)
We have three verticals within defense. The one part of the business is our capital items, which is things that are procured for the fight, and move and that kind of part of the business which is artillery guns, your vehicles, and other specialty products. The second is all your spares and consumables. We currently have a well-balanced business between them, currently our business is, I would say between 300, 400 crores a year of spares and consumables. And our business on the capital side is currently largely vehicle lead. And we have a business of roughly about 200 to 250 crores a year currently, on the vehicle side, this can go up. And we’re looking at global opportunities in this. And we are also looking at global opportunities on the consumable side. So if you look at today, our total business I would say it’s somewhere in the region of 400, 500 crores a year and a two, three year horizon or let’s say 25, 26 horizon is how do we take this to 1500 crores a year. Plus, 300, 400 crores of exports so, we are looking at growing the business simply 3x and creating a suite of products that will keep giving us this kind of business going on and also look at global opportunities because some of the new products that are developed in India are really world class and we have the opportunity to supply them globally. (Q1FY23 earnings call)
- Optionality from EV business
Tork Motors which is the company we’ve invested in and has already started serial deliveries of their vehicles and also are now supplying three-wheeler powertrain in fairly large quantities. New plant for this company is under final installation, and from November they will be starting production in new plant which will increase the capacity almost 10 times.(Q1FY23 earnings call)
Our center for light weighting and e-mobility starting to gain traction with order wins from both automotive and industrial customers. We expect this to see increased I mean see the results of this from FY23 onwards.(Q2FY22 earnings call)
We have two categories of components we are focusing on. One is light weighting components which are metallurgical product either forged or cast which were supplying to a variety of OEMs across the world and that business is ramping up quite aggressively. Just in terms of forging we have enough capacity today to take our aluminum forging business from approximately currently 70 million to about 250 million with the capacities on hand and order book on hand. Secondly this does not include the casting side that business will also ramp up over the next two to three years and we expect that this will also grow at a double digit pace, but more interestingly and exciting for us is our entire e-mobility components and systems business where we are supplying power electronics, control electronics, components, systems and subsystems for EVs all the way from 48 volt to 800 volt. So, here we have embedded systems-based products like DC-DC controller. AC-DC controllers, inverters, butterfly controllers and all kinds of products. So here we expect revenues to start from next year and ramp up substantially by 23 24 to triple digit million-dollar kind of figure (Q2FY22 earnings call).
Also, Bharat forge has recently done a JV with Harbinger motors to build EV powertrains (Sep 13, 2022)
- Ramp up of JS Auto and Sanghvi Forgings
JS Auto – We have completed the acquisition of J.S. Auto at an EV of 490 crores. This is a good company, it was purchased on 1st of July, so it will be consolidated in Q2. We can expand this business with almost no capex and generate double the revenues. Additionally, we get into a lot of new sectors, which we didn’t have that much presence and become a bigger and stronger supplier in areas such as construction equipment, mining equipment, renewable energy, hydraulics, and many other industrial products. (Q1FY23 earnings call)
Sanghvi forgings, the revenue when we bought it was about Rs. 380 crore. Our goal is that in 5 years, we should be able to triple it. (Q4FY22 earnings call). I am happy to report that Sanghvi acquisition has been PBT positive in the first quarter after our acquisition. (Q2FY22 earnings call). The reason for buying this company it has a capability to make products that are slightly bigger than our existing product portfolio and it helps us expand our product offering especially for the renewable energy and wind sector.(Q1FY22 earnings call)
This kind of business has a high entry barrier in terms of, it is a capital-intensive business. So setting up a Greenfield project in India or somewhere else and doing the business at these prices I think is easy now. So rather the OEMs will not have much option and now particularly with China-Plus-One strategy which all OEMs have mandatorily started having, the wallet share of OEMs will move away from China to India. Threat can only be through technological changes which happen in terms of ICE and EV. (Senior Ex-employee)
Capacity availability :
| Capacity (Tonnes) | Comments and utilization | ||
| US | Steel | 30000 | Ramp up to happen & capacity doubling in 2 years |
| Aluminium | 10000 | Ramp up to happen & capacity doubling in 2 years | |
| Germany/ France / Sweden | Steel | 190000 | 40% |
| Aluminium | 30000 | 40% | |
| India | Steel | 403750 | Not required for atleast 2 years |
| Aluminium | 2400 | Not required for atleast 2 years | |
| Sanghvi Forging Steel | 20000 | 20% when acquired | |
| JS Autocast – Industrial | 50000 | Can be doubled with almost negligible capex | |
Key risks
Impact of US/ Europe recession
So, the U.S. and European commercial vehicle market, we see them at least as of now, fairly robust for this year and next year. That is the forecast. The order backlogs are quite healthy right now. So, most of these guys have slots booked for the next 12 to 15 months as well. So, as of today, all of this is fairly robust. As far as the supply chain disruption is concerned, I would say there are normal supply chain disruptions. There is nothing that is a very significant showstopper right now. There is a lot of volatility and there is a lot of let me say, disruptions, if you will. But they are able to manage and that is still supporting production outflow. (Q4FY22 Management guidance)
EV in CV
As of now CV seems to be the latest automotive segment which will be impacted by the transition to EV. Any significant change in there could deeply impact them. And if that transition happens in a gradual or phased manner and the company has already invested like Bharat Forge, from the public domain you must be knowing, they are already manufacturing, started in power train business for EVs. They will be making power trains. So if that transition they are able to do very fast then they are going to compensate for the loss of the business in a phased manner.