Fertilizer Industry of India overview and major products
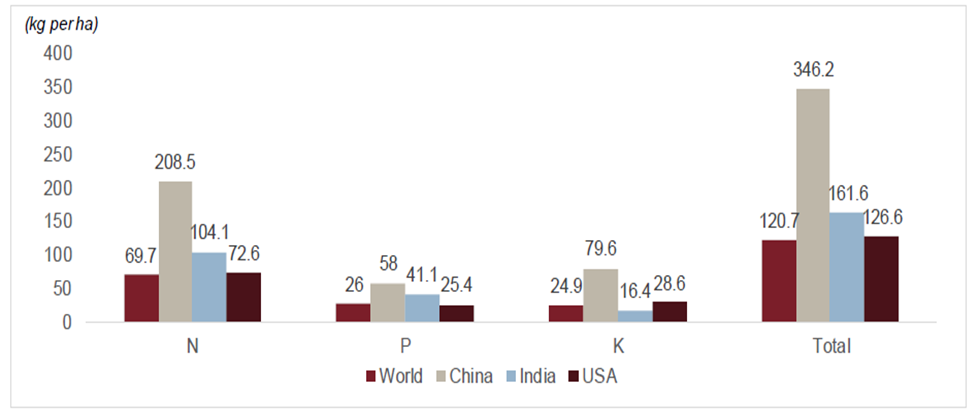
The plant nutrition industry consists of mainly 3 elements – Nitrogen (N), Phosphorus (P) and Potassium (K). The ideal ratio required is 4:2:1 in Nitrogen, Phosphorus and Potassium. Following are the consumption details of the elements:
India consumes higher quantity of fertilizer per hectare of Arable Land and Land under Permanent Crops compared to global average. The per hectare fertilizer consumed in India is higher than the global average. Nitrogenous fertilizers, especially urea, are consumed significantly higher in India compared to most countries in the world. India’s consumption per hectare is also higher compared to USA. However, China is way ahead in terms of all product categories and has more than double the consumption per hectare compared to India.
The following is the high-level consumption details of major fertilizers in India:
| In Million tonnes | Market Size | Domestic Production | Imports | Growth projected |
| DAP – Diammonium Phosphate | 11 | 4.5 | 6.5 | 2%-3% |
| Urea | 35 | 25 | 9 | 1%-2% |
| SSP – Single Super Phosphate | 4.3 | 4.3 | 0 | 5% |
| Muriate of Potash | 4.2 | 0 | 4.2 | 2%-3% |
Urea is the main source of Nitrogen, DAP provides both Nitrogen and Phosphorus, SSP provides phosphorus and Muriate of Potash provides potassium. Given that DAP is imported from outside, the government is pushing to increase the production of SSP over DAP. However, DAP has more effectiveness.
Growth of fertilizer industry in India
During fiscals 2021 to 2026, demand for overall fertilizers is expected to witness a compound annual growth rate (CAGR) of 1.5-2.5% to ~68 million tons rising from 61 million tons in fiscal 2021. Urea is expected to grow at a 0.8-1.8% CAGR to 34-35 million tons. Urea will continue to have a dominant share in fertilizers owing to higher preference among marginalized farmers (constituting ~45% based on holding size) and middle-income farmers.
However, growth is expected to be much slower than the fifteen-year growth of ~2.5% CAGR due to increasing awareness among farmers regarding soil fertility.
On the other hand, non-urea fertilizers are expected to register 2.2-3.2% CAGR to reach 32.5-33.5 million tons. Initiatives taken by the government (soil health card scheme) towards increasing awareness among farmers and training programs conducted by fertilizer companies will be the key growth drivers.
As part of the scheme, a total of 107 million and 115 million soil health cards were distributed in the first (2015-17) and second cycle (2017-19) of the scheme, respectively. The adoption of non-urea fertilizers is projected to increase in the long term driven by under-penetration. The CAGR for fertilizer consumption is only marginally higher during fiscals 2021-26 as compared to 1.9% clocked during FY16-21 due to a high base of fiscal 2021.
The NPK ratio languished to 6.6:2.7:1.0 in fiscal 2020 from 4.7:2.3:1 in fiscal 2011 due to increased usage of urea over the years. Going ahead, the ratio is expected to improve to 5.8:2.6:1.0 by fiscal 2026 led by government’s efforts to increase awareness about soil fertility and higher adoption of fertilizer mixtures (complex fertilizers) instead of single-nutrient fertilizers. In spite of this, the ratio is likely to be much higher than the ideal NPK ratio (4:2:1) required for optimum soil productivity.
During the preceding five years from fiscal 2015 to fiscal 2020, DAP was the fastest growing product within the non-urea segment. It grew at a CAGR of ~5.3% during the corresponding period; complex fertiliser came in second growing at ~3.3%. Over the next five years from fiscal 2021 to fiscal 2026, DAP and complex fertilizers are expected to continue to drive the segment growth along with complex fertilisers as India’s production of crops like fruits and vegetables, sugarcane, cotton, etc. see a higher growth compared to the past. Also, governments attempt on reducing urea consumption and growing awareness regarding benefits of complex and Phosphatic fertilisers will aid these products over the next five years. The government has also to encourage of non-urea fertilisers through introduction of nutrient based subsidy for P&K fertilisers.
The demand for DAP and NPKS fertilisers is catered through both domestic production as well as imports. However, a significant share of NPKS demand is met domestically, while almost more than half of the DAP demand is met through imports which indicates significant opportunity for domestic players. On the other hand, almost 90% of the NPKS demand is met through domestic production. Demand for MOP is largely met through imports while that for SSP is largely met through domestic production. Imports for all product segments have increased over the last five years from fiscal 2017 to 2021.
Government subsidy:
The current subsidy provided by the government on the major fertilizers is as follows:
| In INR | MRP | Subsidy | Total Price |
| Diammonium Phosphate | 1350 | 2501 | 3851 |
| Nitrogen, Phosphorus Potassium fertilizer | 1470 | 1918 | 3388 |
| Muriate of Potash | 1700 | 759 | 2459 |
| Urea | 267 | 2183 | 2450 |
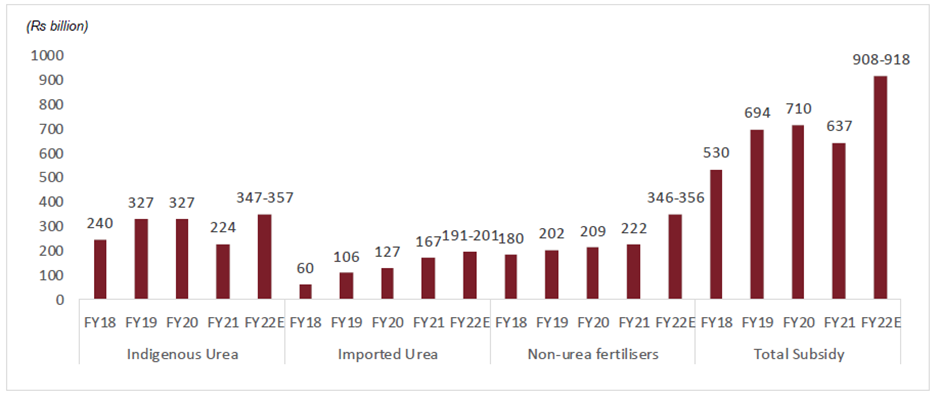
Given the high amount of subsidy, the government fertilizer subsidy bill has increased significantly as can be seen below:
Liquid biofertilizers are gaining popularity
Liquid biofertilizers are technical modifications of carrier-based fertilizers. These are liquid inoculant formulations containing sprayable particles of the inoculant mixed with a suitable medium. It helps extend the viability of fertilizers and enhances biological activity. Formulations can be in semi-dry form or suspensions containing oil or water-based emulsions. Formulations contain not only the desirable growth medium, but also some form of dormant spores or cysts that extend shelf life and increase tolerance to adverse weather conditions. Liquid biofertilizers have several benefits over carrier-based biofertilizers, such as:
Longer shelf life
More cost effective
Easy and quick quality-control protocols
Absence of contamination, which ensures high enzymatic activity that further enables absorption of nutrients by plants
Less dependent on temperature and humidity
Easier to use, with 10 times lower dosage than carrier-based powder biofertilisers
Bio-fertilizer industry to grow at 13-14% CAGR over next 3 fiscals
Replacement of DAP by Nano DAP
DAP (Di-Ammonium Phosphate) is a conventional fertilizer that is widely used in agriculture. It is produced by reacting ammonia with phosphoric acid to produce ammonium phosphate, which is then granulated. Nano DAP, on the other hand, is produced by reducing the size of DAP particles to nano-levels. The main difference between Nano DAP and DAP is that Nano DAP has a higher surface area-to-volume ratio, which enhances its nutrient uptake efficiency and reduces the amount of fertilizer required.
Nano DAP has the potential to replace conventional DAP and other fertilizers in certain applications. Here are some potential replacements:
- Conventional DAP: Nano DAP can potentially replace conventional DAP as it has a higher surface area-to-volume ratio, which enhances its nutrient uptake efficiency and reduces the amount of fertilizer required.
- Other fertilizers: Nano DAP has the potential to replace other fertilizers such as urea and potash in certain applications as it can improve the nutrient uptake efficiency of plants.
- Soil conditioners: Nano DAP can also potentially replace soil conditioners such as humic acid and fulvic acid as it can improve soil fertility and nutrient availability.
It is important to note that the effectiveness of Nano DAP as a replacement for conventional fertilizers and soil conditioners depends on several factors, including the crop, soil type, and environmental conditions. Further research is needed to determine the full potential of Nano DAP as a replacement for conventional fertilizers and soil conditioners.
Below is the price comparison for the conventional DAP and Liquid DAP (Nano DAP)
| Comparison | MRP | Subsidy | Total |
| DAP -50 Kg Bag | 1350 | 2650 | 4000 |
| Liquid DAP (Nano DAP) – 500 ml | 600 |
Given that nano DAP can reduce both the subsidy and import bill, there is strong push by government to move towards Nano DAP. Also, even if Nano DAP starts penetrating the market and companies start being able to build that capability, the revenues of the companies could severely be impacted.
Volatility of DAP prices
The volatility of DAP price has increased recently and hence in 2022, the revenues of most fertilizer companies in India grew significantly. However the prices have reduced from the peaks.
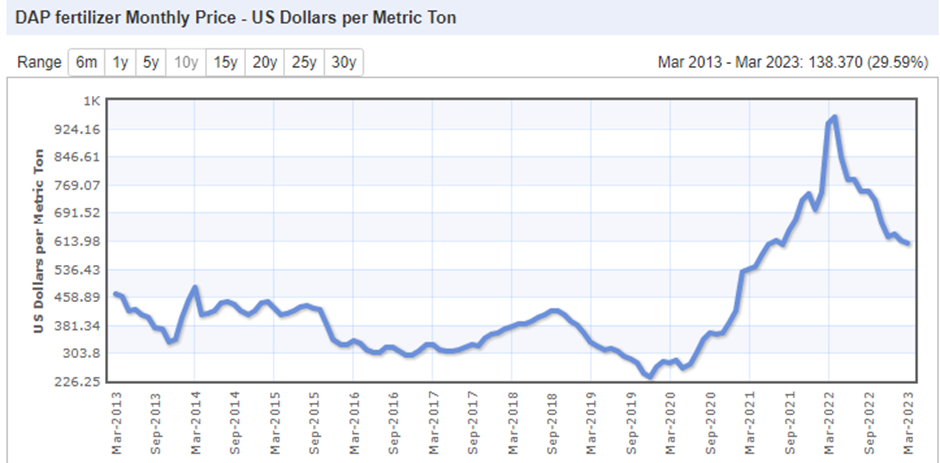
Any significant reduction in the price of DAP will impact the revenues of the company significantly.
Raw materials
The 4 key raw materials used in production of fertilizers are:
- Natural gas
- Phosphoric acid
- Fuel oil
- Rock phosphate
Key challenges for fertilizer industry:
High degree of government control
Since independence, the Government of India has formulated several policies to support the fertilizer industry in general and to control and maintain the prices of essential fertilizers at low levels in particular. However, its approach changed in 1991, when as part of the economic liberalization program, it gradually began relaxing its control on the industry.
The government controls have influenced the extent of investments in the fertiliser industry, entry and exit of players, degree of competition and marketing and distribution strategies of players. For instance, the retention price scheme (RPS), introduced in the late seventies, for urea players (that was implemented till fiscal 2003) provided a 12% post-tax return on net worth, which encouraged investments, but did not grant incentives for cost efficiency. In addition, the government’s norms on marketing and distribution of fertilisers influenced the level of competition in the industry, since it specified not only the states to which each company could sell its products, but also the quantum of supply.
Varied feedstock base
Feedstock is the raw material used in the manufacture of fertiliser. The feedstock used in the manufacture of nitrogenous fertilisers (natural gas, naphtha, coal, fuel oil, LSHS or external ammonia) is different from that used in the manufacture of phosphatic fertilisers (phosphoric acid and sulphur). The feedstock used in a plant determines the overall cost of production, subsidy allocation and also to some extent the profitability of the plant. The availability and cost of the feedstock, the technology used in the plant and also the location of the plant is some of the reasons for the use of varied feedstock.
As of November 2018, 79.3% of the domestic nitrogenous capacity was based on captive ammonia production, while the remaining 14.6% is procured externally. Of the captive ammonia capacity, around 79.3% is based on natural gas, 5.8% on naphtha, and the rest on others such as caprolactam, LSHS and coal etc. Though the capacity under captive ammonia production has been more or less constant since fiscal 2007 (on a year-on-year basis), the contribution of natural gas as a feedstock for nitrogenous industries has increased during this period. This is mainly on the back of switch from fuel oil to natural gas. Also, efforts of the government and players to convert from high-cost feedstock (naphtha) to natural gas have helped improve share of natural gas in overall feedstock. Going forward, this trend is expected to continue.
Phosphoric acid and sulphur are the primary raw material used in the production of the major phosphatic fertilisers, SSP and DAP. Companies either purchase phosphoric acid or produce it using rock phosphate and other inputs. A few companies have their own manufacturing facilities, while the rest import their requirements.
Heavy dependence on imported fertilizers due to insufficient capacities
While India is one of the largest fertilizer consumers in the world, it is also one of the major importers around the globe, on account of lower capacities compared to consumption. While the demand for urea has remained around 30 million tonnes over the past few years, its capacities have remained more or less stagnant at around 22-24 million tonnes. Moreover, India does not have any manufacturing capacities for MOP.
Vulnerability to fluctuations in international fertilizers and raw material prices
Indian fertiliser industry is not only dependent on imported fertilisers, but for imports of raw materials as well. However, requirement of imported raw materials varies from company to company, depending upon the product mix. On account of this, Indian fertiliser industry is highly vulnerable to the fluctuations in the international prices of key raw materials such as rock phosphate, phosphoric acid, ammonia, sulphur, sulphuric acid etc.
While for urea players, the entire rise in costs is pass-through by government in the form of subsidy, complex players are more vulnerable as the subsidy provided to them is nutrient-based (fixed). Although the retail prices of complex fertilisers are market driven w.e.f. April 1st, 2010, offsetting the rise in raw material cost by hiking price at similar levels is not possible, as this would result in subdued demand.
Production is energy intensive
The fertiliser industry, especially the nitrogenous fertiliser segment, is energy intensive. Energy sources are used not only as feedstock, but also to meet the power and fuel requirements of the industry. As feedstock, these are used to produce ammonia, which is then converted into nitrogenous fertilisers. The material cost, and the power and fuel expenses of the nitrogenous fertiliser segment constitutes more than 70-75% of the total production cost. Most plants are set up near feedstock sources to maximise locational advantages.
Read more about other industries here