a. Business Model:
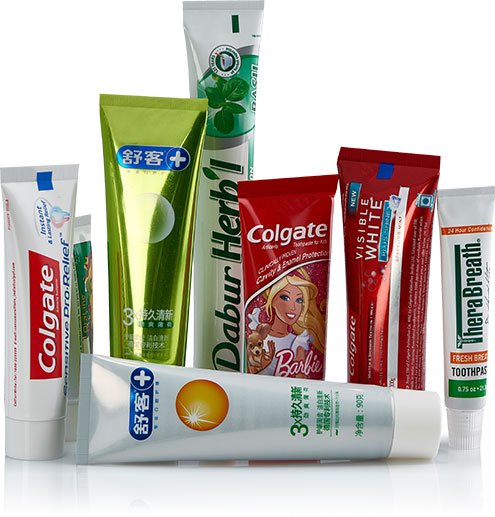
3M produces thousands of imaginative products – from health care and highway safety to office products and abrasives and adhesives. It has more than 50000 products in the market and has manufacturing facilities at Bangalore, Ahmedabad, Pune & Pondicherry.
3M Businesses can be primarily classified in the following categories:
a. Consumer and Office Business – Supplies an array of products that keep homes cleaner, offices organized and buildings well–maintained, we’re home to some of the world’s best–known brands, including Scotch, Post–it, Scotch–Brite and Scotchgard.
b. Display and Graphics Business – They are a world leader in films that brighten the displays on electronic products, such as flat–panel computer monitors, cellular phones, personal digital assistants and liquid crystal display (LCD) televisions.
c. Electro and Communications Business – They’re a leading supplier of innovative solutions to the electrical, electronics and communications industries.
d. Health Care Business – 3M Health Care is a global leader in medical and oral care products, and drug delivery and health information systems.
e. Industrial and Transportation Business – They strive to understand the diverse market segments – construction, food and beverage, metal fabrication, oil and gas, woodworking and more – that make up the industrial marketplace.
b. Financials:
Sales growth:
Annual Sales have increased from 2734 Cr in 2018 to 3000 Cr in 2020. This is not a huge increase compared to Indian growth rates. The growth rate has been only 10% nett in 2 years.
EBITDA/ PAT Growth:
PAT has been flat between 2018 and 2020 at 322 Cr. EBITDA rather reduced by 15% between 2018 and 2020.
Margin:
The EBITDA margin reduced from 20% to 17% between 2018 and 2020. PAT margin reduced from 12% to 11% in the same period.
ROE: Declined from 31% to 20% from FY18 to FY20. FY20 ROE is 20%
ROCE: Declined from 48% to 27% from FY18 to FY20. FY20 ROCE is 27%
Debt and coverage:
Debt is almost negligible.
c. Shareholding:
Promoters hold 75% stake and institutions hold 11.4% stake.
d. Expensiveness: PE ratios:
Earning per share: Rs. 135, Share price : 27032; PE ratio = 201; Price to book ratio = 17; Industry average PE ratio is 29.
Historically the PE ratio has been between 50 and 75.
Dividend Yield : 0.0%
EV/ EBITDA is 41.4
In conclusion, the company financials and performance has not been great and also is very expensive compared to historical levels.
For more ideas – click here


