Company Overview
Sona BLW Precision Forgings is one of India’s leading automotive technology companies, designing, manufacturing and supplying highly engineered, mission critical automotive systems and components such as differential assemblies, differential gears, conventional and micro-hybrid starter motors, BSG systems, EV traction motors (BLDC and PMSM) and motor control units to automotive OEMs across US, Europe, India and China, for both electrified and non-electrified powertrain segments. The company is a technology and innovation driven company. With a strong focus on research and development (R&D), it develops mechanical and electrical hardware systems, components as well as base and application software solutions, to meet the evolving demands of its customers. It is one of a few companies globally, with the ability to design high power density EV systems handling high torque requirements with a lightweight design, while meeting stringent durability, performance and NVH specifications, enabling EV manufacturers to enhance the vehicle range, acceleration and the overall efficiency.
The company has nine manufacturing and assembly facilities across India, China, Mexico and USA, of which six are located in India, from where it supplies its products to six out of the top ten global PV OEMs, three out of the top ten global CV OEMs and seven out of the top eight global tractor OEMs by volume. It currently supplies differential assemblies, differential gears, EV Traction Motors to customers in US, China and India, for use in hybrid and battery electric passenger vehicles, hybrid and battery electric light commercial vehicles, electric two-wheelers and electric three-wheelers.
Product profile
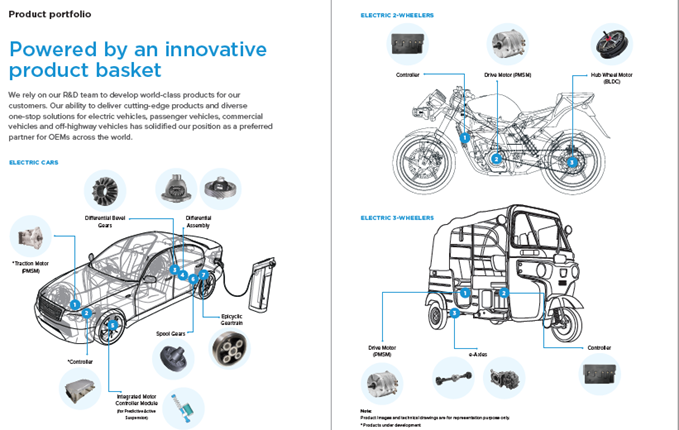
For electric cars:
Traction motors
Controllers
Differential level gears
Differential assembly
Integrated motor controller module
Spool gears
2 wheelers:
Drive motor
Controller
Hub wheel motor
Electric 3 wheelers:
Drive motor
Controller
E-axles
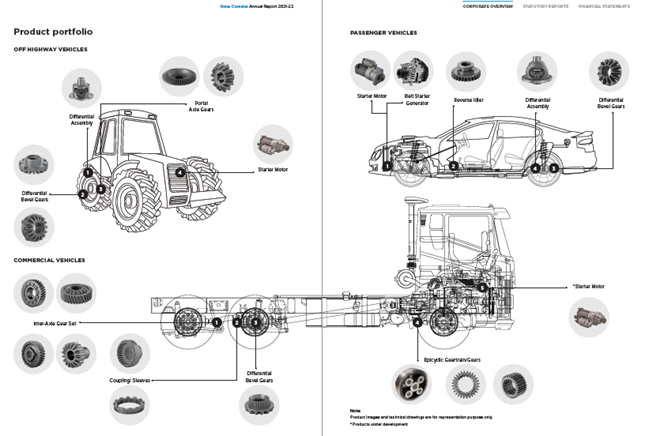
Off highway vehicles:
Differential assembly
Differential gears
Portal axle gears
Starter motors
CVs:
Inter axle gear set
Coupling sleeves
Differential gears
Passenger vehicles:
Static motor/ Belt start generator
Reverse idler
Differential assembly
Clients:
| Client | Revenue Share |
| Ford US | 17% |
| Ford EU | 15% |
| Global EV OEM | 13% |
| Renault | 7% |
| Dana | 6% |
| Tata motors | 5% |
| John Deer | 5% |
| M&M | 4% |
| Linamar | 4% |
| Others | 24% |
Revenue distribution:
Order book:
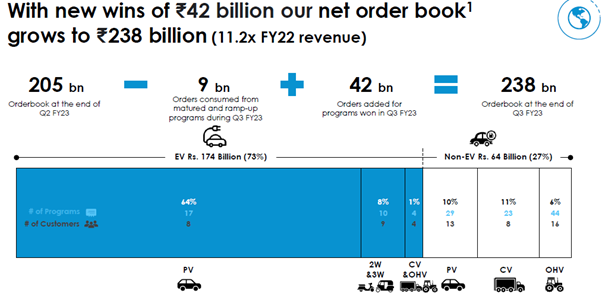
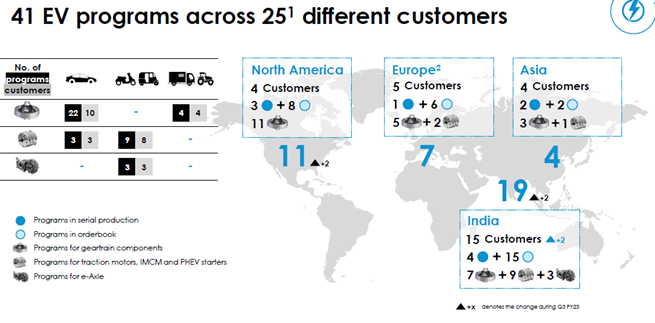
Order book at 18600 crores already which is 9 times of current revenue (62% EV). There are 30 EV programs across 19 different countries. As per the management meeting, the orderbook generally gets executed over the next 5 – 10 years. For every order
Potential for revenue growth:
| Potential for Growth in BEV | ||
| Product | ICE | BEV |
| Differential assembly cost | $40 per unit | $50 per unit |
| Electric Motor cost | $40 per unit | $1400 per unit for high voltage traction motor |
| Content per vehicle for motor + Differential assembly | $80 per unit | $1450 per unit |
| Content per vehicle total | Rs 6000 per unit | Rs 1000 per unit |
| of which Sona BLW current products | Rs 6000 per unit | Rs 20000 per unit |
News and Information data:
Sona BLW acquisition of Novelic:
The management has suggested that the current revenue of the company is around 2.5 Million euros but has much higher profitability than Sona. They are into precision electronics and advanced driver assistance systems. They say their profit is around 25% of the revenues and expect to reach a sales of 100 Million euros by 2026.
Plants presence:
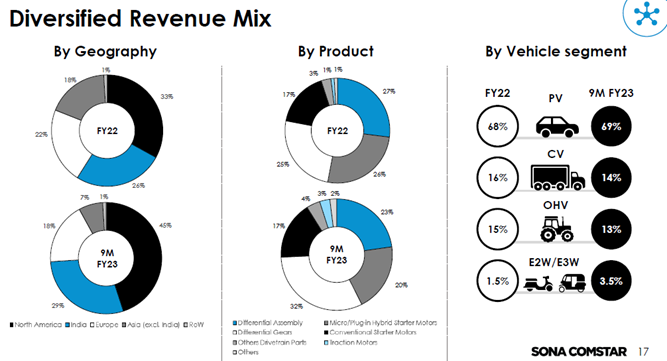
Revenue distribution by products
| Type | Revenue % |
| Differential gears | 25% |
| Micro/ Hybrid starter motors | 26% |
| Differential assembly | 27% |
| Conventional starter motors | 17% |
| Other gears | 3% |
| Others | 2% |
Revenue distribution by technology
| Type | Revenue % |
| EV | 25% |
| Micro/ Hybrid | 26% |
| Power Source neutral | 31% |
| ICE dependent | 18% |
Revenue distribution by geography
| Type | Revenue % |
| India | 26% |
| North America | 33% |
| Europe | 22% |
| Rest of Asia/ World | 19% |
Shareholding
Promoter group: 67.18% (Indian 33% and Foreign of 34%)
15% Mutual funds
6.5% Individuals
8.8% FIIs
5% Others
The 34% of foreign promoter group has been sold
Financials – Last 7 quarter results
| Data in Crores | 01-06-2021 | 01-09-2021 | 01-12-2021 | 01-03-2022 | 01-06-2022 | 01-09-2022 | 01-12-2022 |
| Total Revenue from Operations | 498.793 | 577.057 | 485.96 | 550.01 | 584.251 | 652.907 | 675.264 |
| EBITDA | 138.907 | 154.957 | 135.576 | 149.686 | 143.537 | 168.549 | 189.419 |
| Profit after tax | 82.216 | 88.23 | 86.438 | 104.659 | 75.841 | 92.546 | 107.101 |
| Basic EPS | 1.43 | 1.51 | 1.48 | 1.79 | 1.3 | 1.58 | 1.83 |
| Diluted EPS | 1.43 | 1.51 | 1.48 | 1.79 | 1.3 | 1.58 | 1.83 |
| Revenue Growth | -8% | 16% | -16% | 13% | 6% | 12% | 3% |
| Gross Margin | 56% | 53% | 57% | 55% | 54% | 53% | 55% |
| EBITDA Margin | 28% | 27% | 28% | 27% | 25% | 26% | 28% |
| Employee expenses as % of Sales | 9% | 8% | 9% | 7% | 7% | 7% | 7% |
| Other Manufacturing expenses as % of Sales | 20% | 20% | 23% | 23% | 23% | 21% | 22% |


