Skip to content
Mathmarkets
Mathmarkets
  • Home
  • About
  • Company Analysis
  • Industry Analysis
  • Knowledge Bytes
  • Contact
Mathmarkets

Comparison of FMCG companies

chintan, March 8, 2021June 19, 2022

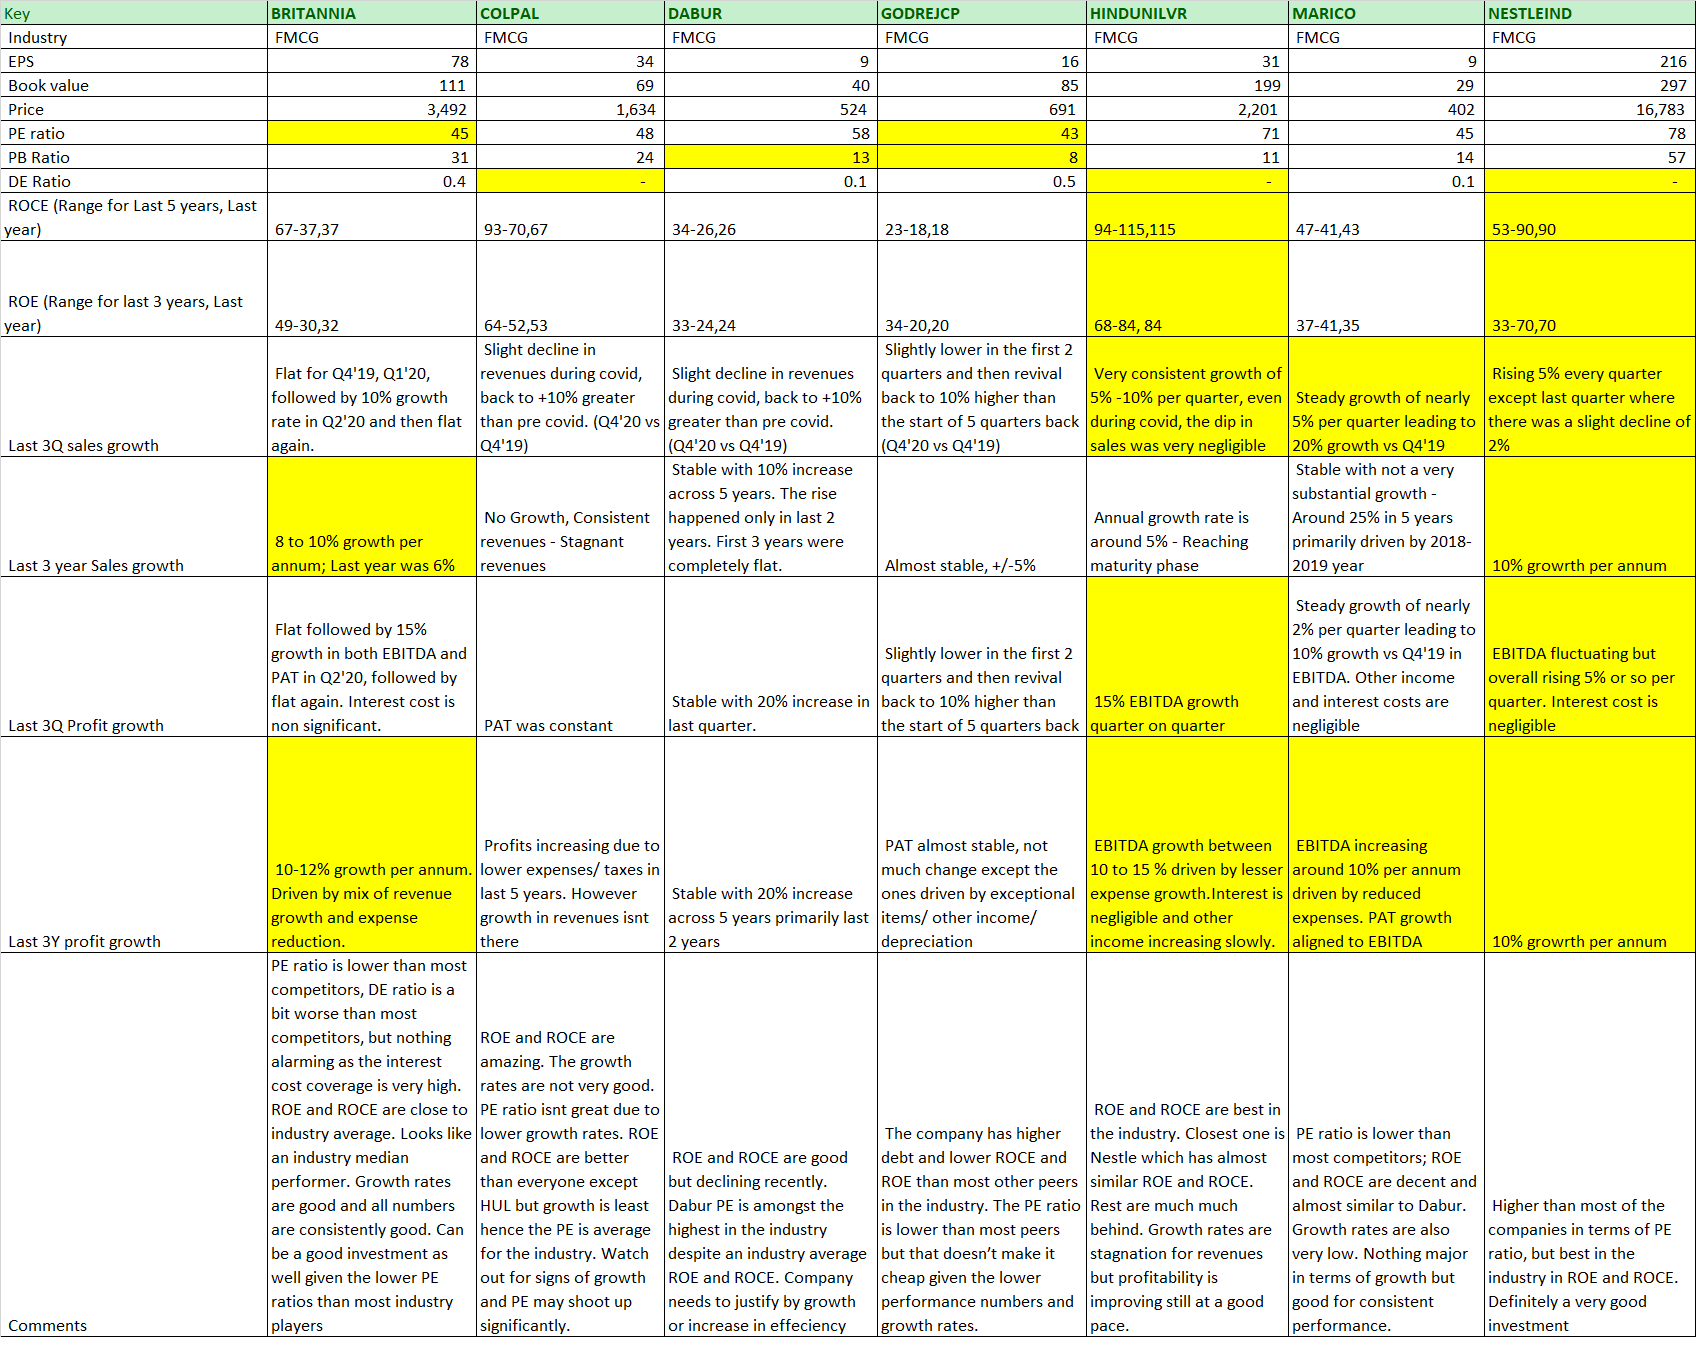
Below is the comparison of the the top FMCG companies in India. The Indian FMCG industry is dominated by 7 players.

Hindustan Unilever is the benchmark in terms of performance. If we look closely at the comparison below, Nestle ranks high (compared to the other players excluding HUL) in most parameters and is reasonably valued as compared to HUL. It is growing a good rate as well and looks like a good investment. HUL has the best capital and performance ratios in the industry but is really expensive. On the other hand, Dabur has a high PE with not very great ROE and ROCE ratios. Also, the growth rates are not justifying the high ratios currently. Marico and Britannia have good growths and better financial performance and are relatively cheaper and hence can be considered for a good investment. Colgate Palmolive has been very stagnant in terms of revenue growth over the past few years. Overall, HUL (Best but expensive), Nestle (2nd best and relatively inexpensive), Marico and Britannia (Growing and relatively inexpensive); Dabur (Not great but expensive).


The columns highlighted in yellow indicate the best performer in the industry for that parameter.


If you like this comparison of FMCG companies, I have made similar comparisons for other major sectors in the Indian equities space. For more such industry analysis, please see my other comparisons.

Industry Analysis

Post navigation

Previous post
Next post

Related Posts

Industry Analysis

Fundamental scores of companies

June 7, 2021June 20, 2022


Read More
Industry Analysis Battery

Global battery industry

May 20, 2024May 20, 2024

Following are some of the key numbers about the global and Indian battery industry and the expected evolution of both of them. Global battery industry In terms of revenue, the global battery industry was valued at $111.86 billion in the year 2021 and is projected to reach $423.90 billion by…

Read More
Industry Analysis IT employees

Infosys vs TCS – Employee costs trends

August 15, 2021June 20, 2022


Read More

Leave a Reply Cancel reply

Your email address will not be published. Required fields are marked *

Recent Posts

  • India’s car industry growth prospects
  • Road length and density by country
  • Comparison of textile yarn companies
  • Go Fashion
  • India consumption story

Subscribe to Math Markets

Loading

Archives

  • March 2025
  • January 2025
  • December 2024
  • November 2024
  • October 2024
  • September 2024
  • August 2024
  • July 2024
  • June 2024
  • May 2024
  • April 2024
  • March 2024
  • February 2024
  • November 2023
  • September 2023
  • August 2023
  • July 2023
  • May 2023
  • July 2022
  • June 2022
  • April 2022
  • September 2021
  • August 2021
  • July 2021
  • June 2021
  • May 2021
  • April 2021
  • March 2021
  • February 2021

Categories

  • Company Analysis
  • Industry Analysis
  • Knowledge Bytes
  • Uncategorized
All the contents published on this blog and other tools offered are the property of Chintan Shah. All rights reserved. The information contained on this website and the resources available for download through this website are for educational and informational purposes only. The stocks discussed in this blog are the research and personal views of the authors should ‘not’ be considered as any kind of buy, sell or any advisory/recommendation.
©2025 Mathmarkets | WordPress Theme by SuperbThemes